Description
Community charts are essential visual aids designed to represent and illustrate various aspects of community life, demographics, health, education, and social services. These charts are valuable tools for community planners, educators, healthcare providers, and local governments, helping them understand and address the needs of the community effectively.
Key Features:
Comprehensive Data Representation:
Visual representation of community demographics, including age, gender, ethnicity, and income levels.
Detailed charts on public health statistics, education levels, employment rates, and housing conditions.
User-Friendly Design:
Clear and easy-to-understand graphics, charts, and tables.
Color-coded sections to enhance readability and quick reference.
Educational Value:
Ideal for use in schools, community centers, and public health campaigns.
Supports community education programs by providing accessible information.
Versatile Applications:
Useful for community planning, resource allocation, and policy-making.
Aids non-profits and social service organizations in identifying and addressing community needs.
Durable and Portable:
Printed on high-quality, tear-resistant material for durability.
Portable charts that can be easily displayed in various community settings.
Applications:
Community Planning: Helps local governments and planners make informed decisions regarding infrastructure, services, and resource allocation.
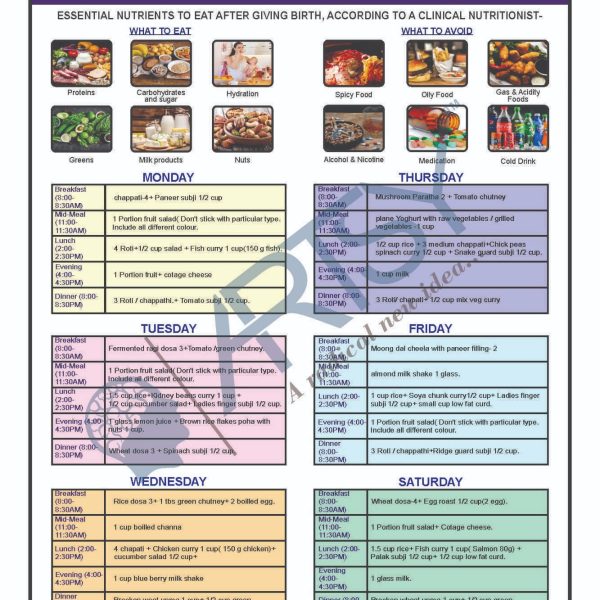
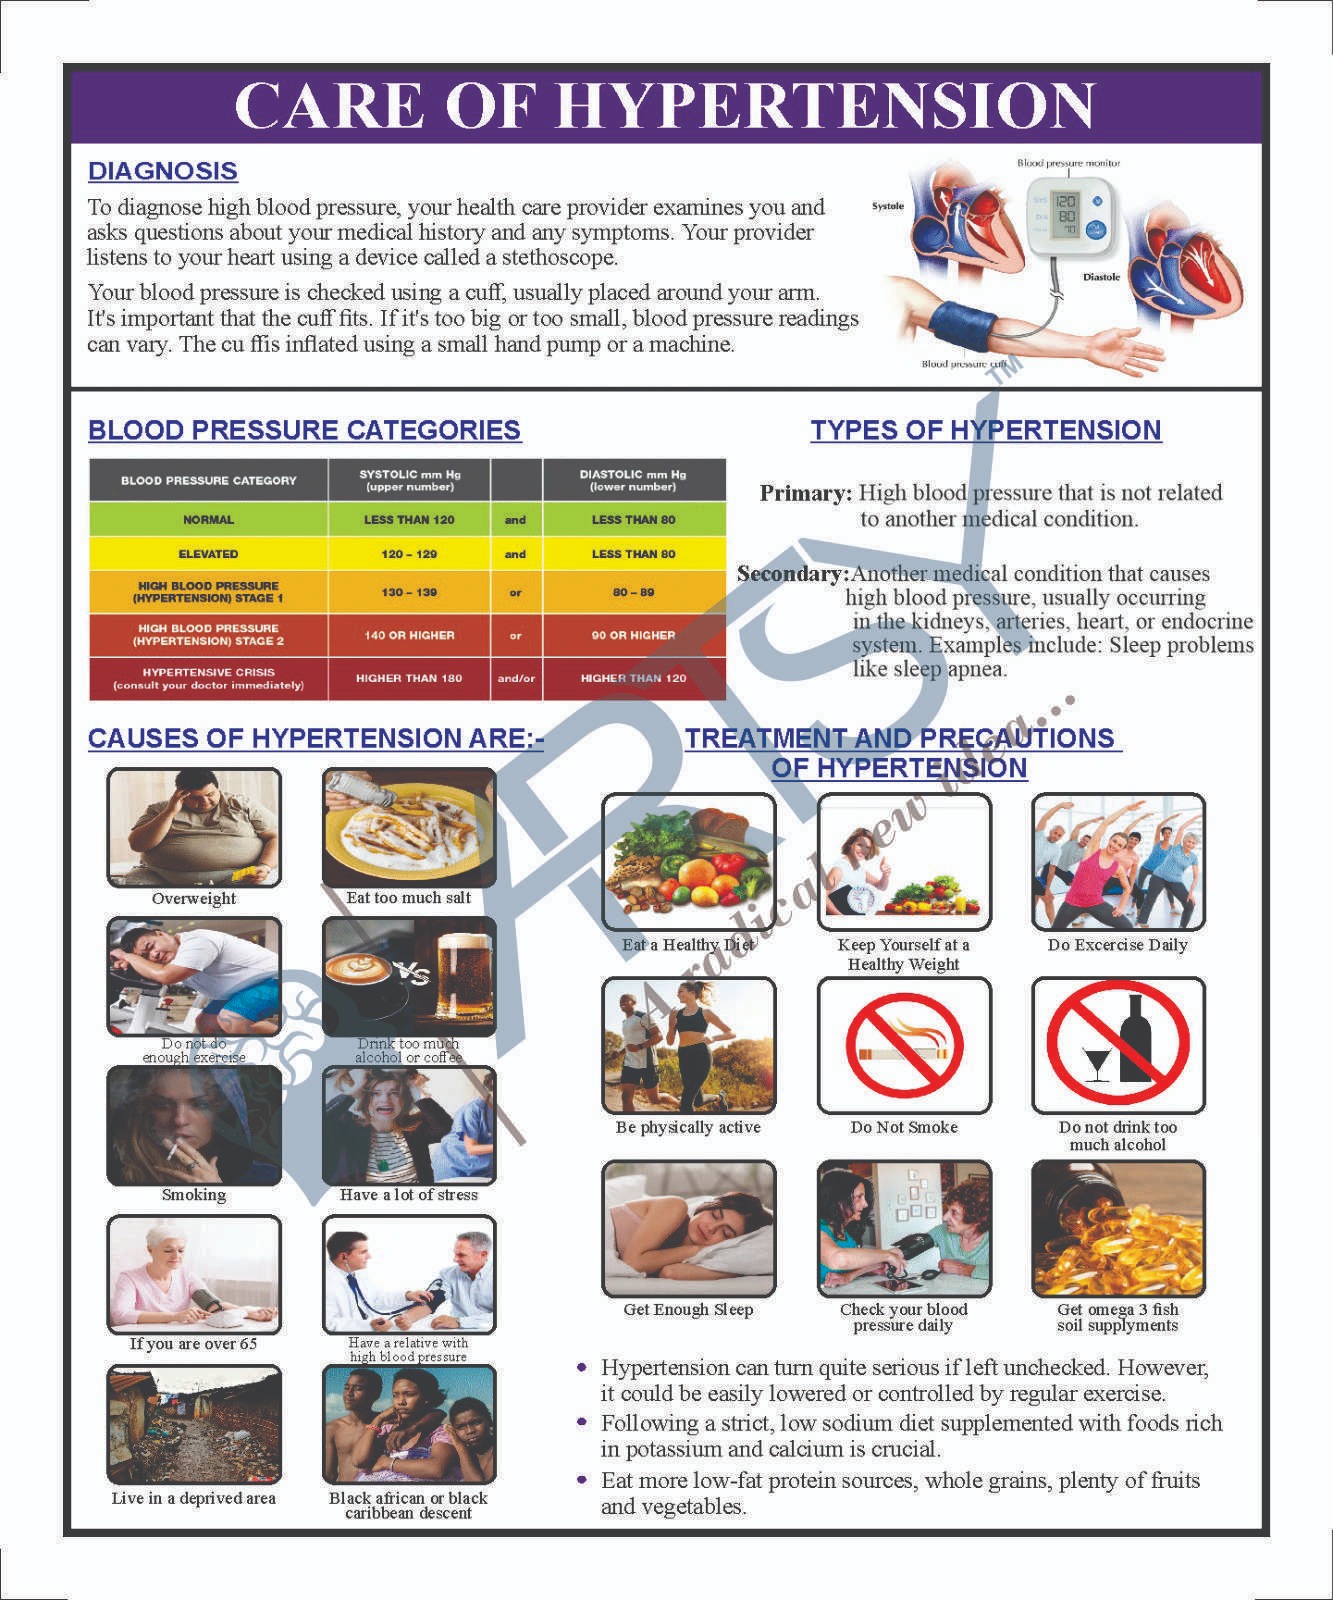
Public Health: Assists in tracking and addressing community health issues, promoting wellness programs, and improving healthcare services.
Education: Enhances community education by providing visual aids for understanding local demographics, school performance, and educational needs.
Social Services: Supports social service organizations in identifying at-risk populations and tailoring services to meet community needs.
Examples of Community Charts:
Demographic Charts:
Population distribution by age, gender, and ethnicity.
Income levels and employment rates.
Health Charts:
Prevalence of common health conditions and diseases.
Access to healthcare services and vaccination rates.
Education Charts:
Literacy rates and educational attainment.
School enrollment and graduation rates.
Housing Charts:
Housing conditions and affordability.
Homeownership vs. rental rates.
Social Services Charts:
Availability and utilization of social services.
Statistics on homelessness, food insecurity, and other social issues.
Why Choose Our Community Charts?
Investing in our community charts means equipping yourself with reliable, visually appealing tools to understand and improve community life. Whether you’re a community leader, educator, healthcare provider, or social service professional, our charts provide essential insights and data to support your work






Reviews
There are no reviews yet.